Industry · Logistics & Freight
Align reps to the freight regions that drive revenue.
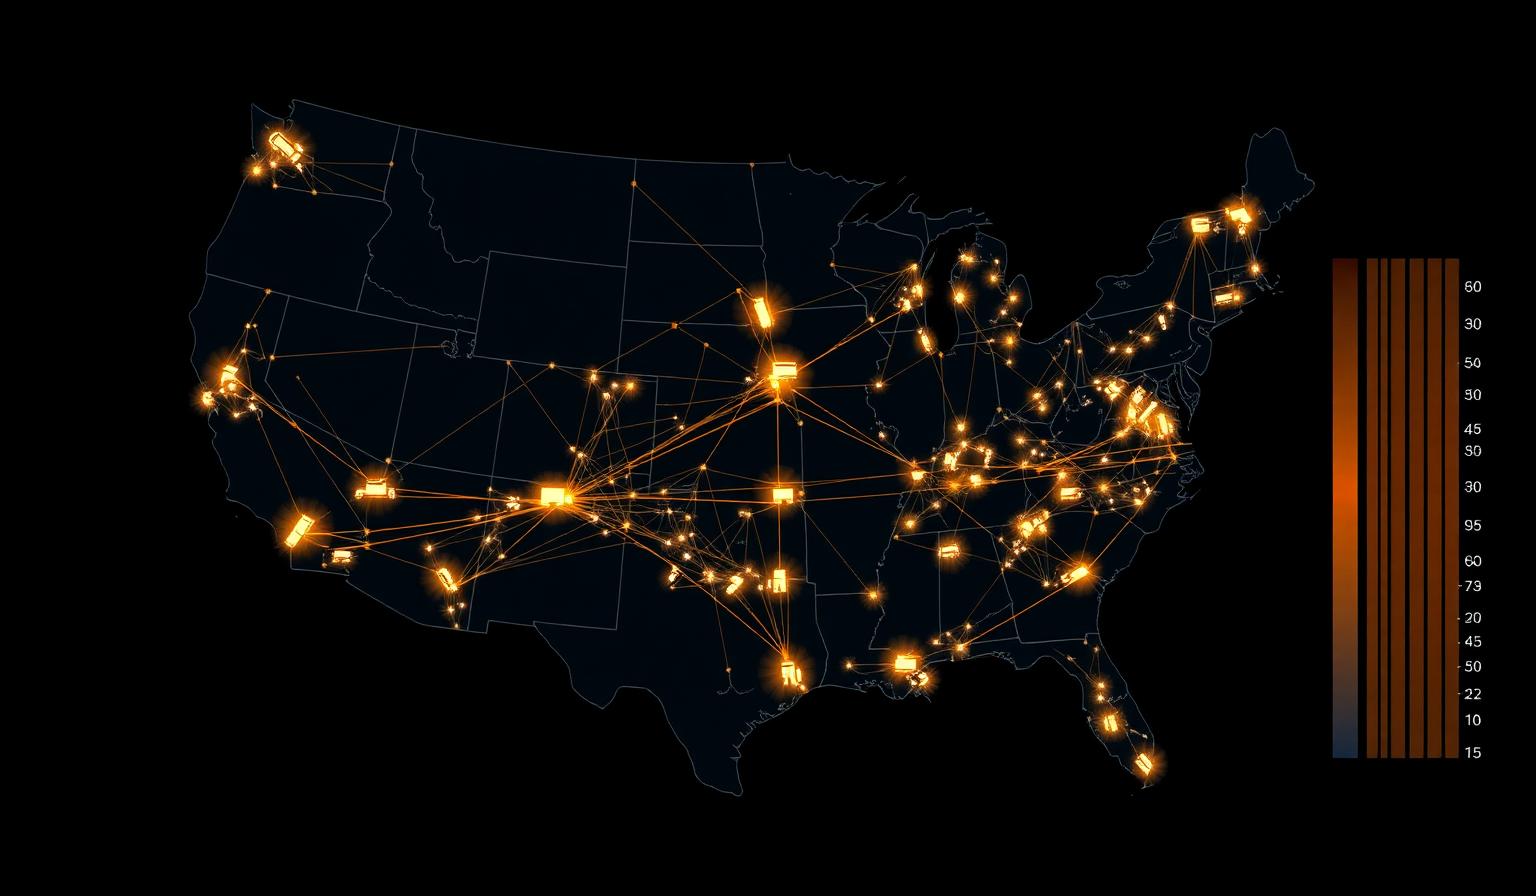
Show shipper locations along major corridors, visualize lane density, and align reps to regions with the highest freight potential.
Lane density and shipper concentration move faster than rep territory definitions — so coverage drifts away from the freight.
What you'll map
Corridors, lanes, and rep coverage on one map.
- Plot shippers, consignees, and terminals along major corridors.
- Visualize lane density and origin-destination flow.
- Carve regions by freight potential, not just geography.
- Track rep coverage and pipeline against lane opportunity.
Built for these roles
- · VP Sales
- · Lane Strategy
- · Capacity Planner
Week-one playbook
- 1
Plot shippers + terminals
Layer O/D pairs, volumes, and revenue on the corridor view.
- 2
Visualize lane density
See where freight actually moves vs. where reps are assigned.
- 3
Realign regions to revenue
Reshape territories by freight potential, not historical map lines.
Territories
Carve markets by ZIP, county, or custom polygons and assign reps with balanced coverage.
Routing
Cluster stops, plan visit cadence, and optimize drive time across each rep's week.
Analytics
Overlay revenue, volume, or potential on the map to focus effort where it pays back fastest.
Try a live map for Logistics & Freight
Spin up a sample territory map with industry-tuned layers in minutes.
Frequently asked
Ready to map Logistics & Freight?
Get a guided walk-through with your data on the map.