Our Products
Cloud-based software for all your franchise & healthcare needs
One platform for territory mapping, franchise sales, recruiting, and payer connectivity — purpose-built for modern healthcare networks.
Everything you need in one place
Each product works on its own and gets stronger together.
Territory Map Builder
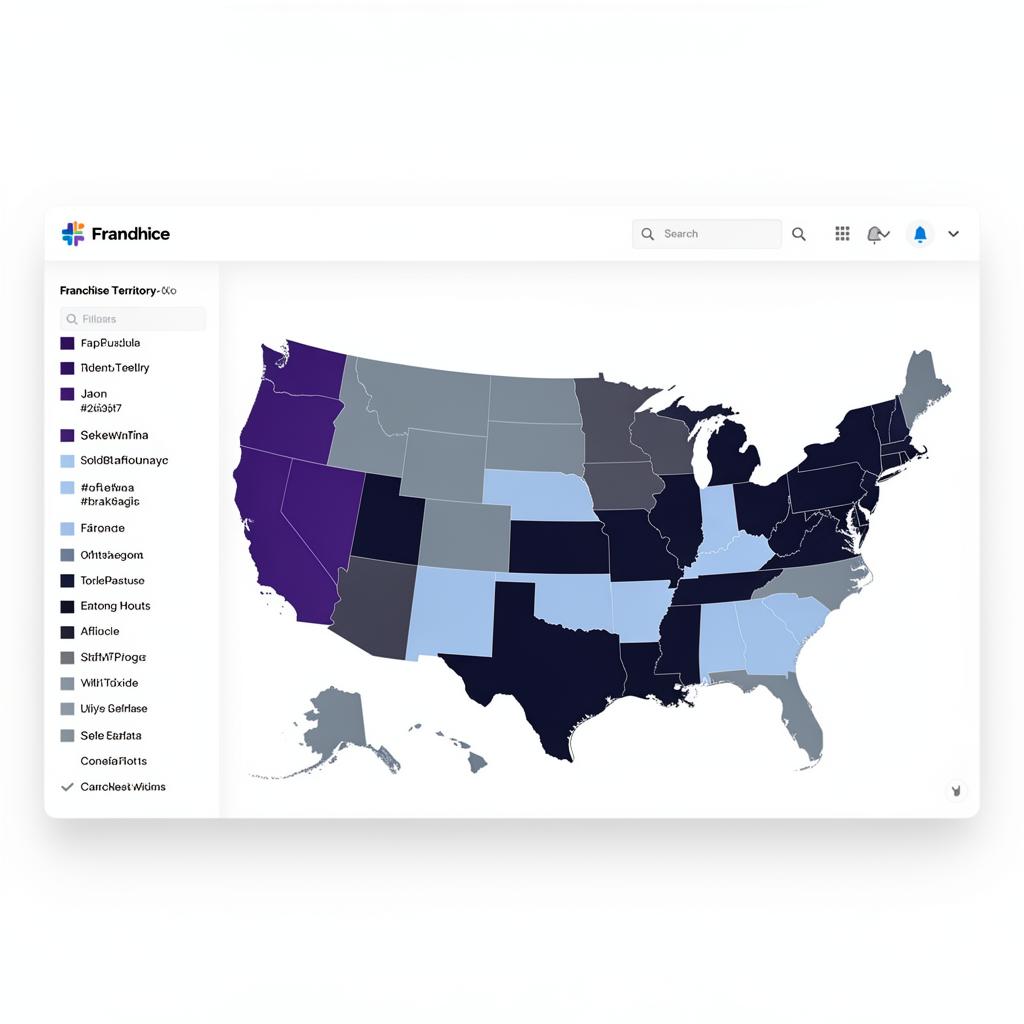
Design, lock, and assign multi-county franchise territories on an interactive U.S. map with live economic data.
Open the mapFranchises For Sale
A public marketplace of available franchise territories, with built-in inquiry workflow and pricing.
Browse listingsPayer Directory
Search 10,000+ healthcare payers, transaction types, enrollment requirements, and attachment support.
Search payersRecruiting & Jobs
Post jobs across the network, collect applications, and route candidates to the right franchise.
View jobsTerritory Catalog
Browse the full catalog of territories — sold, listed, or reserved — with owner and licensing detail.
See territoriesPerformance Analytics
Track plan vs actual sales, growth, and economics across every franchise and territory.
Log inWhy teams choose us
Built for healthcare franchise networks
From the first territory you reserve to the last claim you route — we handle the full operational stack so you can focus on growth.
- 10,000+ healthcare payer connections
- County-level economic & firm data
- Built-in CRM, jobs board, and inquiries
- Admin controls and role-based access
- Public marketplace for franchise sales
- Cloud-based, no installs required
See it in action
Inside the Territory Map Builder
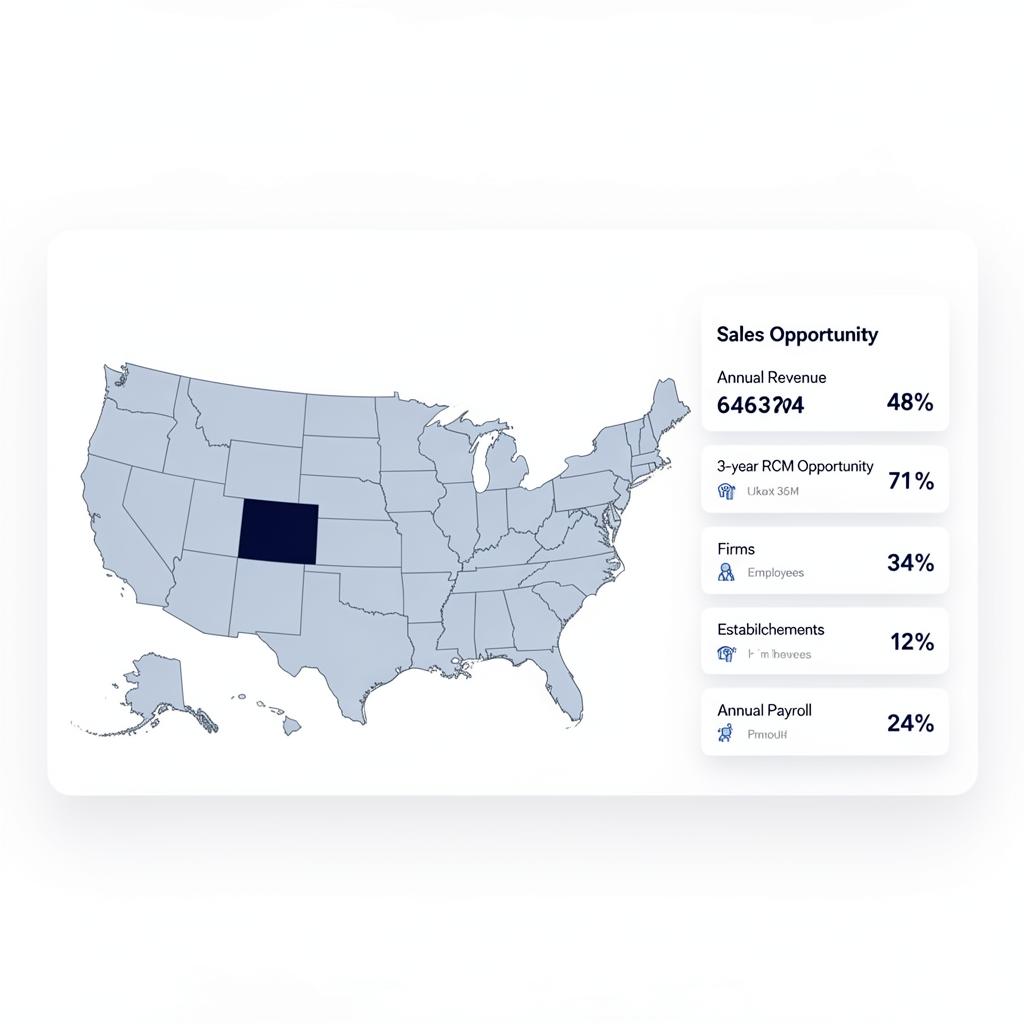
Plan multi-county franchise zones and drill into per-county revenue opportunity.

Built for medical centers
From the loading dock to the lobby
Synergy maps the providers, payers, and people that actually drive collections in each market — so your operations team can see the same picture your physicians and front desks live in every day.

Where the data comes from
Every claim is a conversation
Behind every chart is a patient, a payer, and a clinician. We surface the trends without losing the human shape of the work.
Analytics that matter
Denials, mix, and the levers that move them
Clean-claim rate
97.2%
+1.8
Days in A/R
28.4
−3.1
Net collection
98.6%
+0.9
First-pass yield
94.1%
+2.4
Denials by reason · last 30 days
136 −8% vs prior
Payer mix
5 segments
- Commercial42%
- Medicare28%
- Medicaid18%
- Self-pay7%
- Other5%
Ready to see it in action?
Create a free account and start exploring territories, payers, and jobs in minutes.